
A Guide to Reading DC Motor and Gear Motor Performance Charts
Catalog
Decoding Electric Motor Performance Curves: A Simplified GuideKey Parameters ExplainedMastering Motor Performance Curves: A Practical GuideContinuous and Intermittent UsageFrequently Ask QuestionsRelated ArticlesDecoding Electric Motor Performance Curves: A Simplified Guide
Understanding and interpreting electric motor performance curves can appear daunting, but ISL is here to assist you. At first glance, the graph may seem like a chaotic jumble of intersecting lines, but it is actually a highly effective tool for illustrating the performance and capabilities of a motor or gear motor. Our aim in this design note is to make it easier for you to comprehend and interpret the performance curves commonly found on motor or gear motor datasheets.
Key Parameters Explained
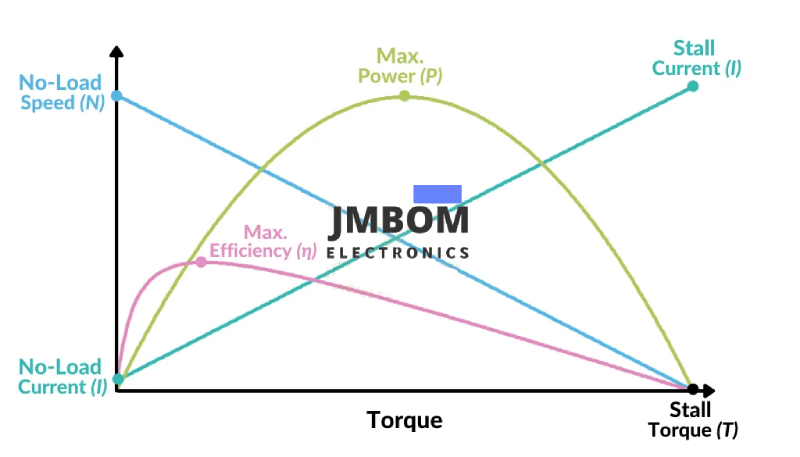
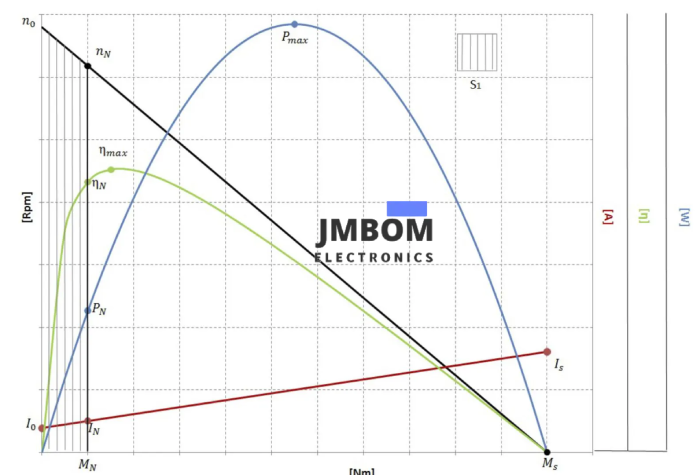
A motor or gear motor performance curve conveys five essential parameters: speed, torque, current draw, power, and efficiency. The overall performance data will highlight the optimal operating conditions for the motor as well as its limitations. This information is crucial for determining whether the motor is suitable for your specific application or device.
Speed (N)
Speed is measured in revolutions per minute (rpm) and is depicted by a straight, downward-sloping line that shows the relationship between torque and speed across the entire power band (refer to the blue line in the example above). Since speed and torque are inversely proportional, this line will decrease linearly as torque increases, reaching 0 rpm at the stall point.
Speed and torque have an inverse relationship. The motor's speed is highest when it produces the least torque, and when torque is at its maximum, the motor barely turns.
Efficiency (η)
Efficiency is the ratio of output power to input power, expressed as a percentage (%). The efficiency curve is generally parabolic, with the peak occurring at lower torque values (refer to the pink line in the example above). Efficiency typically peaks early in the torque range and then gradually declines as the motor approaches its stall torque.
Operating the motor near its peak efficiency ensures optimal motor life and power consumption. It is best practice to use a motor at or near its peak efficiency. The further the motor operates from maximum efficiency, the less reliable its performance becomes.
Torque (T)
Torque, whether measured in kg-cm, lb-in, or Nm, represents the load that the motor or gear motor output shaft can overcome. On a DC motor or gear motor performance curve, torque is usually represented by the X-axis.
The intersection of the speed line (N) and the X-axis marks the stall torque (T) point. This is where the motor produces its maximum torque and can no longer rotate. It is important to ensure that the force required from the motor is significantly less than the overall torque capacity (stall torque) to prevent motor damage and ensure proper operation.
Current (I)
The current draw is represented by a straight ascending line (refer to the teal line in the example above), reflecting the current drawn from no load to stall conditions. This line illustrates the direct relationship between amperage and torque.
For power-conscious applications, it is best practice to operate the motor at peak efficiency. This provides the most balanced performance while demanding a reasonable amount of current. During motor performance evaluation, noting the current draw will give you a clearer understanding of the on-load conditions the motor experiences in your application.
Output Power (P)
Output power, perhaps the simplest parameter on the graph, shows how much power (in Watts) a motor can deliver (refer to the green line in the example above). Power is a measure of work over time and is typically represented by a standard parabolic shape. The motor's power depends on both speed and torque. Power is low when speed is high and torque is very low, and vice versa. This means power usually peaks at the midpoint between the maximum speed and the stall point.
Mastering Motor Performance Curves: A Practical Guide
Now that we've covered the fundamentals, you can start to decipher what the lines and numbers on a performance curve signify. The performance curve below offers a detailed view of a typical DC gear motor's capabilities. We'll use this curve as a reference to explain how to accurately determine key performance metrics and other crucial factors, such as rated performance.
Here are the specific specifications based on the gear motor performance curve above:
| Parameter | Value | Unit |
|---|---|---|
| No-Load Speed | 58 | rpm |
| No-Load Current | 0.5 | A |
| Rated Speed | 48 | rpm |
| Rated Torque | 2.5 | Nm |
| Rated Current | 2.5 | A |
| Rated Power | 12.8 | W |
| Max. Efficiency | 43 | % |
| Max. Power | 22.7 | W |
| Stall Torque | 15 | Nm |
| Stall Current | 12 | A |
Gear motor performance curves enable you to assess a motor on paper to determine if it's the best fit for your application. By comparing your application's desired performance to the graph, you can theoretically test the motor before ordering samples. Like any electromechanical component, you want it to operate as efficiently as possible. The performance curve can help you easily identify the motor's maximum efficiency point or rated performance.
Rated Performance
To determine the rated or nominal operating performance of a motor/gear motor, start by locating the peak efficiency point (pink line). In the graph above, the peak efficiency is 43%. Once you've found the maximum efficiency point, draw a vertical line through it (see black dotted line), from the top to the bottom of the graph, to identify all other rated performance parameters. Each intersection of your vertical line with another line on the graph indicates a rated performance value.
For the gear motor in the graph above, the rated performance would be: 2.5 Nm, 48 rpm, 43%, 2.5 A, 12.8 W.
Note: Performance curves often have multiple parameter scales on the Y-axis.
Continuous and Intermittent Usage
Electric motors have two usage types defined by their torque capacity. These ranges illustrate the motor's safe operating limits. Defining your duty cycle is essential for determining the usage range of your motor or gear motor.
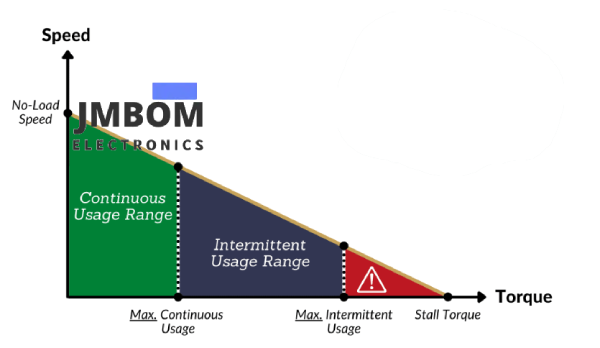
Continuous Usage Range
This range spans from 0% to 30% of the total torque capacity (stall torque). It includes the motor's maximum efficiency point and allows for consistent operation without risking premature failure. Thermal issues are minimal as long as the ambient temperature isn't excessively high. This is the safest operating range for the motor.
Intermittent Usage Range
This range falls between 30% and 60% of the total torque capacity. Here, the motor can handle sporadic tasks but shouldn't run continuously to maintain overall health. Active cooling can extend operation in this range and reduce dwell times. However, the further you move from the maximum efficiency point, the higher the current draw and the greater the risk of premature failure.
Danger Zone
We refer to this area as above 60% of the torque capacity. Operating a motor in this zone is highly discouraged! At these loads, the motor will overheat quickly, increasing the risk of winding burnout and/or gearbox failure.
While these guidelines are helpful for motor selection, they aren't set in stone. Use this information as a reference to aid your motor selection. Always consult your motor vendor or supplier to ensure the motor you choose is optimal for your application and duty cycle. An ISL Products applications engineer can assist with all these aspects. Contact them today with any questions!
Conclusion
We hope this explanation has helped you become more familiar with motor and gear motor performance curves. Not all vendors or manufacturers provide complete motor data, so if a certain parameter is missing, be sure to ask.
Understanding performance data sheets is just one part of the motor selection process. If you're struggling with motor selection, our engineers are here to help! Check out our design note to learn how our application engineers can save you ovstep motor selection guidering the motor selection process.
JMBom Electronics Products has decades of experience providing OEMs with application-specific DC motor and gear motor solutions. Get started today by submitting an inquiry through our easy 3-Step Motor Selection Guide.
Frequently Ask Questions
How Do You Interpret an Engine Performance Curve?
A typical engine performance curve or map, as shown in Figure 3, has the horizontal axis indicating the percentage of the engine's rated speed. The left vertical axis shows the percentage of rated torque. The point where 100% rated torque intersects with the speed represents the engine's maximum rated power.
What’s the Performance Equation for a DC Motor?
The performance equation for a DC motor is Eb = (ΦZN) × (P/A) volts. The applied voltage V must overcome the back electromotive force (e.m.f.) Eb to drive current through the armature conductors. The electrical work done in this process is converted into mechanical energy within the armature.
How Do You Read a Gear Pump Curve?
In a gear pump curve, the vertical axis (Y-axis) represents the Total Dynamic Head, measured in feet or meters. The horizontal axis (X-axis) indicates the flow rate of the fluid being pumped, measured in gallons per minute, liters per second, or cubic meters per hour.
What Are the Three Key Engine Performance Parameters?
The three primary engine performance parameters are power, torque, and specific fuel consumption. Brake torque is typically measured using a dynamometer, where the engine is mounted on a test bed and the shaft is connected to the dynamometer rotor.
How Do You Calculate Motor Performance?
The formula to calculate electric motor efficiency is η = Pm/Pe. Here, η represents efficiency, Pm is the mechanical output power, and Pe is the electrical input power. The electrical input power (Pe) can be calculated by multiplying the current in amperes (I) by the voltage in volts (V).
Related Articles
What are Automotive Relays & How it Works
Thyristor Controlled Reactor (TCR) and Thyristor Switched Capacitor (TSC)
Different Types of Audio Cables and How to Pick the Right One

Christopher Anderson
Christopher Anderson has a Ph.D. in electrical engineering, focusing on power electronics. He’s been a Senior member of the IEEE Power Electronics Society since 2021. Right now, he works with the KPR Institute of Engineering and Technology in the U.S. He also writes detailed, top-notch articles about power electronics for business-to-business electronics platforms.
Subscribe to JMBom Electronics !